
Table of Contents
What is BI?
Business Intelligence (BI) system is a set of tools, processes, and technologies that help businesses gather, analyze, and interpret data to make informed decisions. The primary goal of a BI system is to provide businesses with actionable insights into their operations, customers, and markets, enabling them to make data-driven decisions.
BI systems integrate data from various sources, including databases, spreadsheets, and other applications. They use data visualization tools to present the data in a way that is easy to understand and analyze.
Why Business Intelligence Is Important ?
Business Intelligence (BI) refers to the tools, technologies, and strategies used by organizations to collect, analyze, and transform raw data into meaningful and useful information. BI provides a framework for businesses to make informed decisions and gain a competitive edge in their industry.
Improved decision making
Business Intelligence provides businesses with actionable insights that help them make informed decisions. It helps businesses identify areas where they need to improve and take corrective action. BI also enables businesses to forecast future trends and identify potential risks, allowing them to mitigate these risks before they become a problem.
Increased Efficiency
Business Intelligence can help businesses increase their efficiency by automating routine tasks and reducing manual labor. BI tools can automate data collection, cleaning, and analysis, which saves time and reduces errors. This efficiency translates into cost savings, as businesses can focus on more strategic tasks.
Competitive Advantage
In today’s business environment, where competition is fierce, businesses need to gain a competitive advantage to succeed. Business Intelligence helps businesses gain a competitive edge by providing them with insights into their competitors’ strengths and weaknesses. This information allows businesses to make better decisions about pricing, marketing, and product development, which can give them an edge over their competitors.
Enhanced Data Analysis
Analysis With Business Intelligence, businesses can analyze large amounts of data from various sources, including social media, customer transactions, website traffic, and more. This analysis helps businesses understand their customers, products, and markets better. With a better understanding of the data, businesses can make informed decisions about pricing, marketing, and product development.
How the BI process works
Step 1
Data from source systems is integrated and loaded into a data warehouse or other analytics repository
Step 2
Data sets are organized into analytics data models or OLAP cubes to prepare them for analysis
Step 3
Data is built into data visualization, charts and reports
Step 4
Business executives and workers use the information for decision-making and strategic planning
Meta Metrica
Dashboard
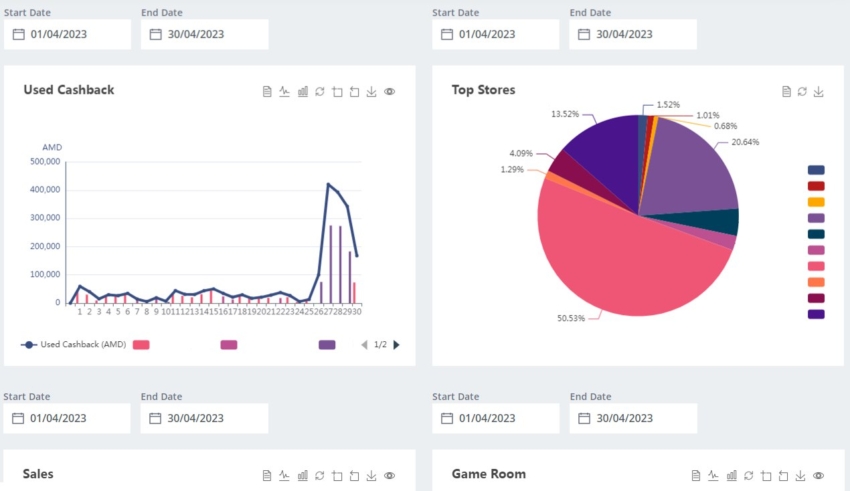
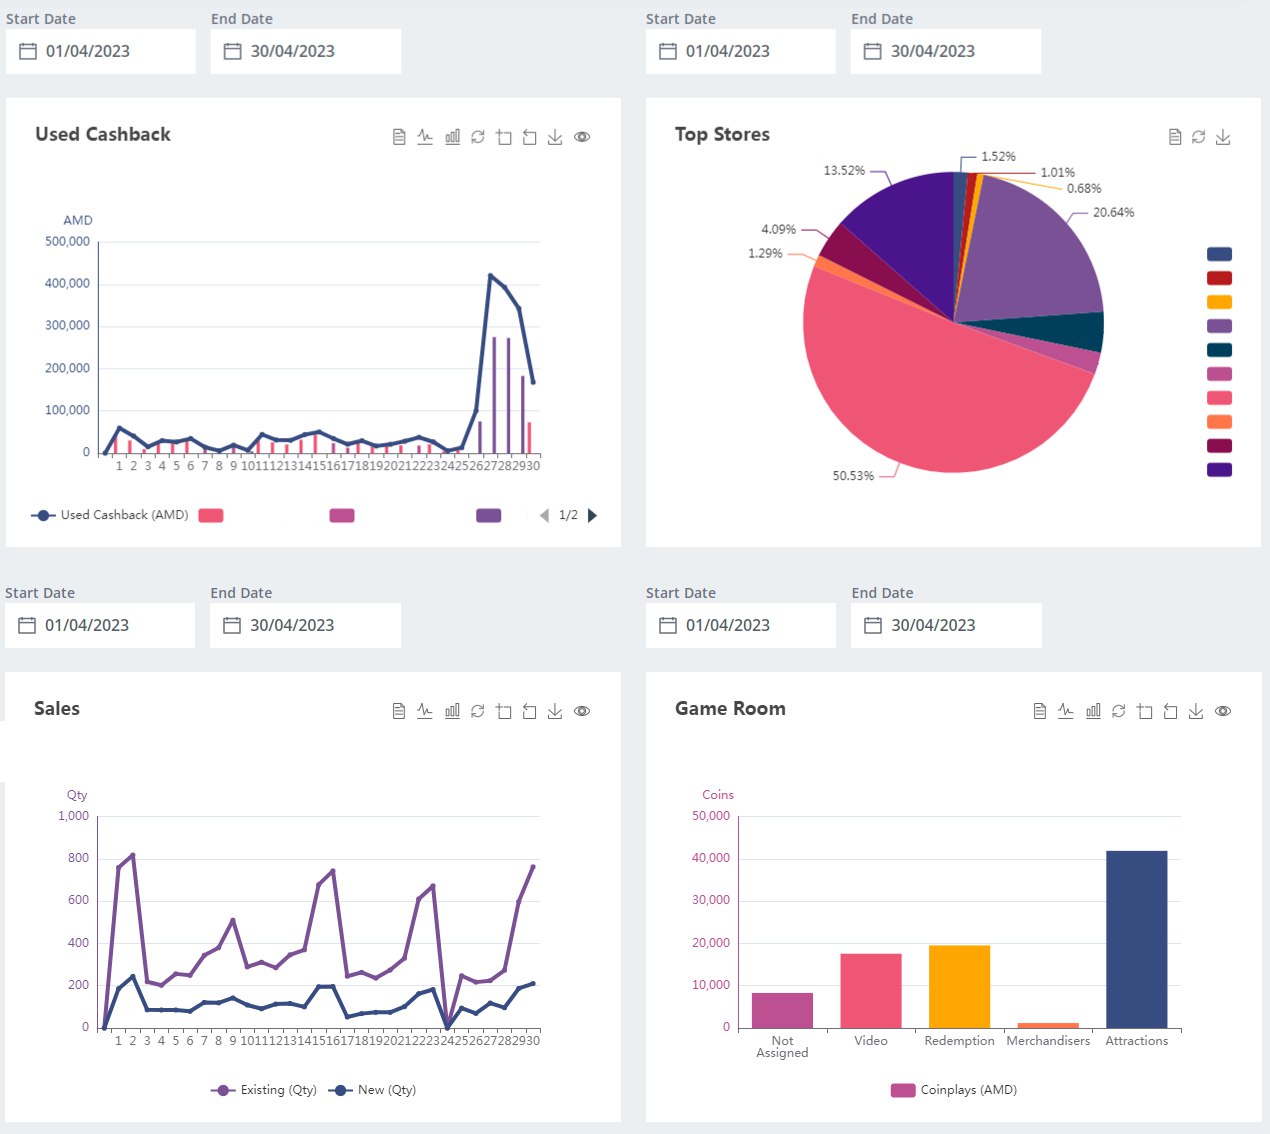
The system consists of several sections, one of which is Dashboard.
Dashboard is a visual representation of an organization’s key performance indicators (KPIs) and metrics, designed to provide a quick overview of the health of the business. The dashboard is made up of a collection of charts, graphs, and other visual elements that are designed to display data in an easy-to-understand format.
The purpose of a dashboard is to provide real-time insight into business operations, allowing stakeholders to quickly identify trends, patterns, and anomalies in the data. The dashboard can be customized to display data from a variety of sources, including databases, spreadsheets, and other data repositories.
Overall, a dashboard is a powerful tool for organizations that want to monitor their performance and make data-driven decisions. By providing a clear and concise view of important metrics, a dashboard can help stakeholders quickly identify areas that require attention and take action to improve performance.
Report Generator
A report generator is a software tool used to create customized reports using every single column of database. It allows users to select data from various sources and generate reports that can be used to analyze and visualize data in a meaningful way.
The data used for generating reports can come from various sources such as databases, spreadsheets, and other applications. Once the data is imported into the report generator, users can manipulate the data and apply filters to create custom reports.
How it works
- Filter your data with any parameters, it can be the countries where the organization is represented, the products/services offered, etc.
- Choose any periods you want, you can also compare periods to better understand the business status
- Select necessary indicators. The system also allows to apply mathematical functions to the indicators and generate the obtained result in the report
- Congrats, report is generated, despite the large amount of data, this operation takes a few minutes at most .
Chart Generator
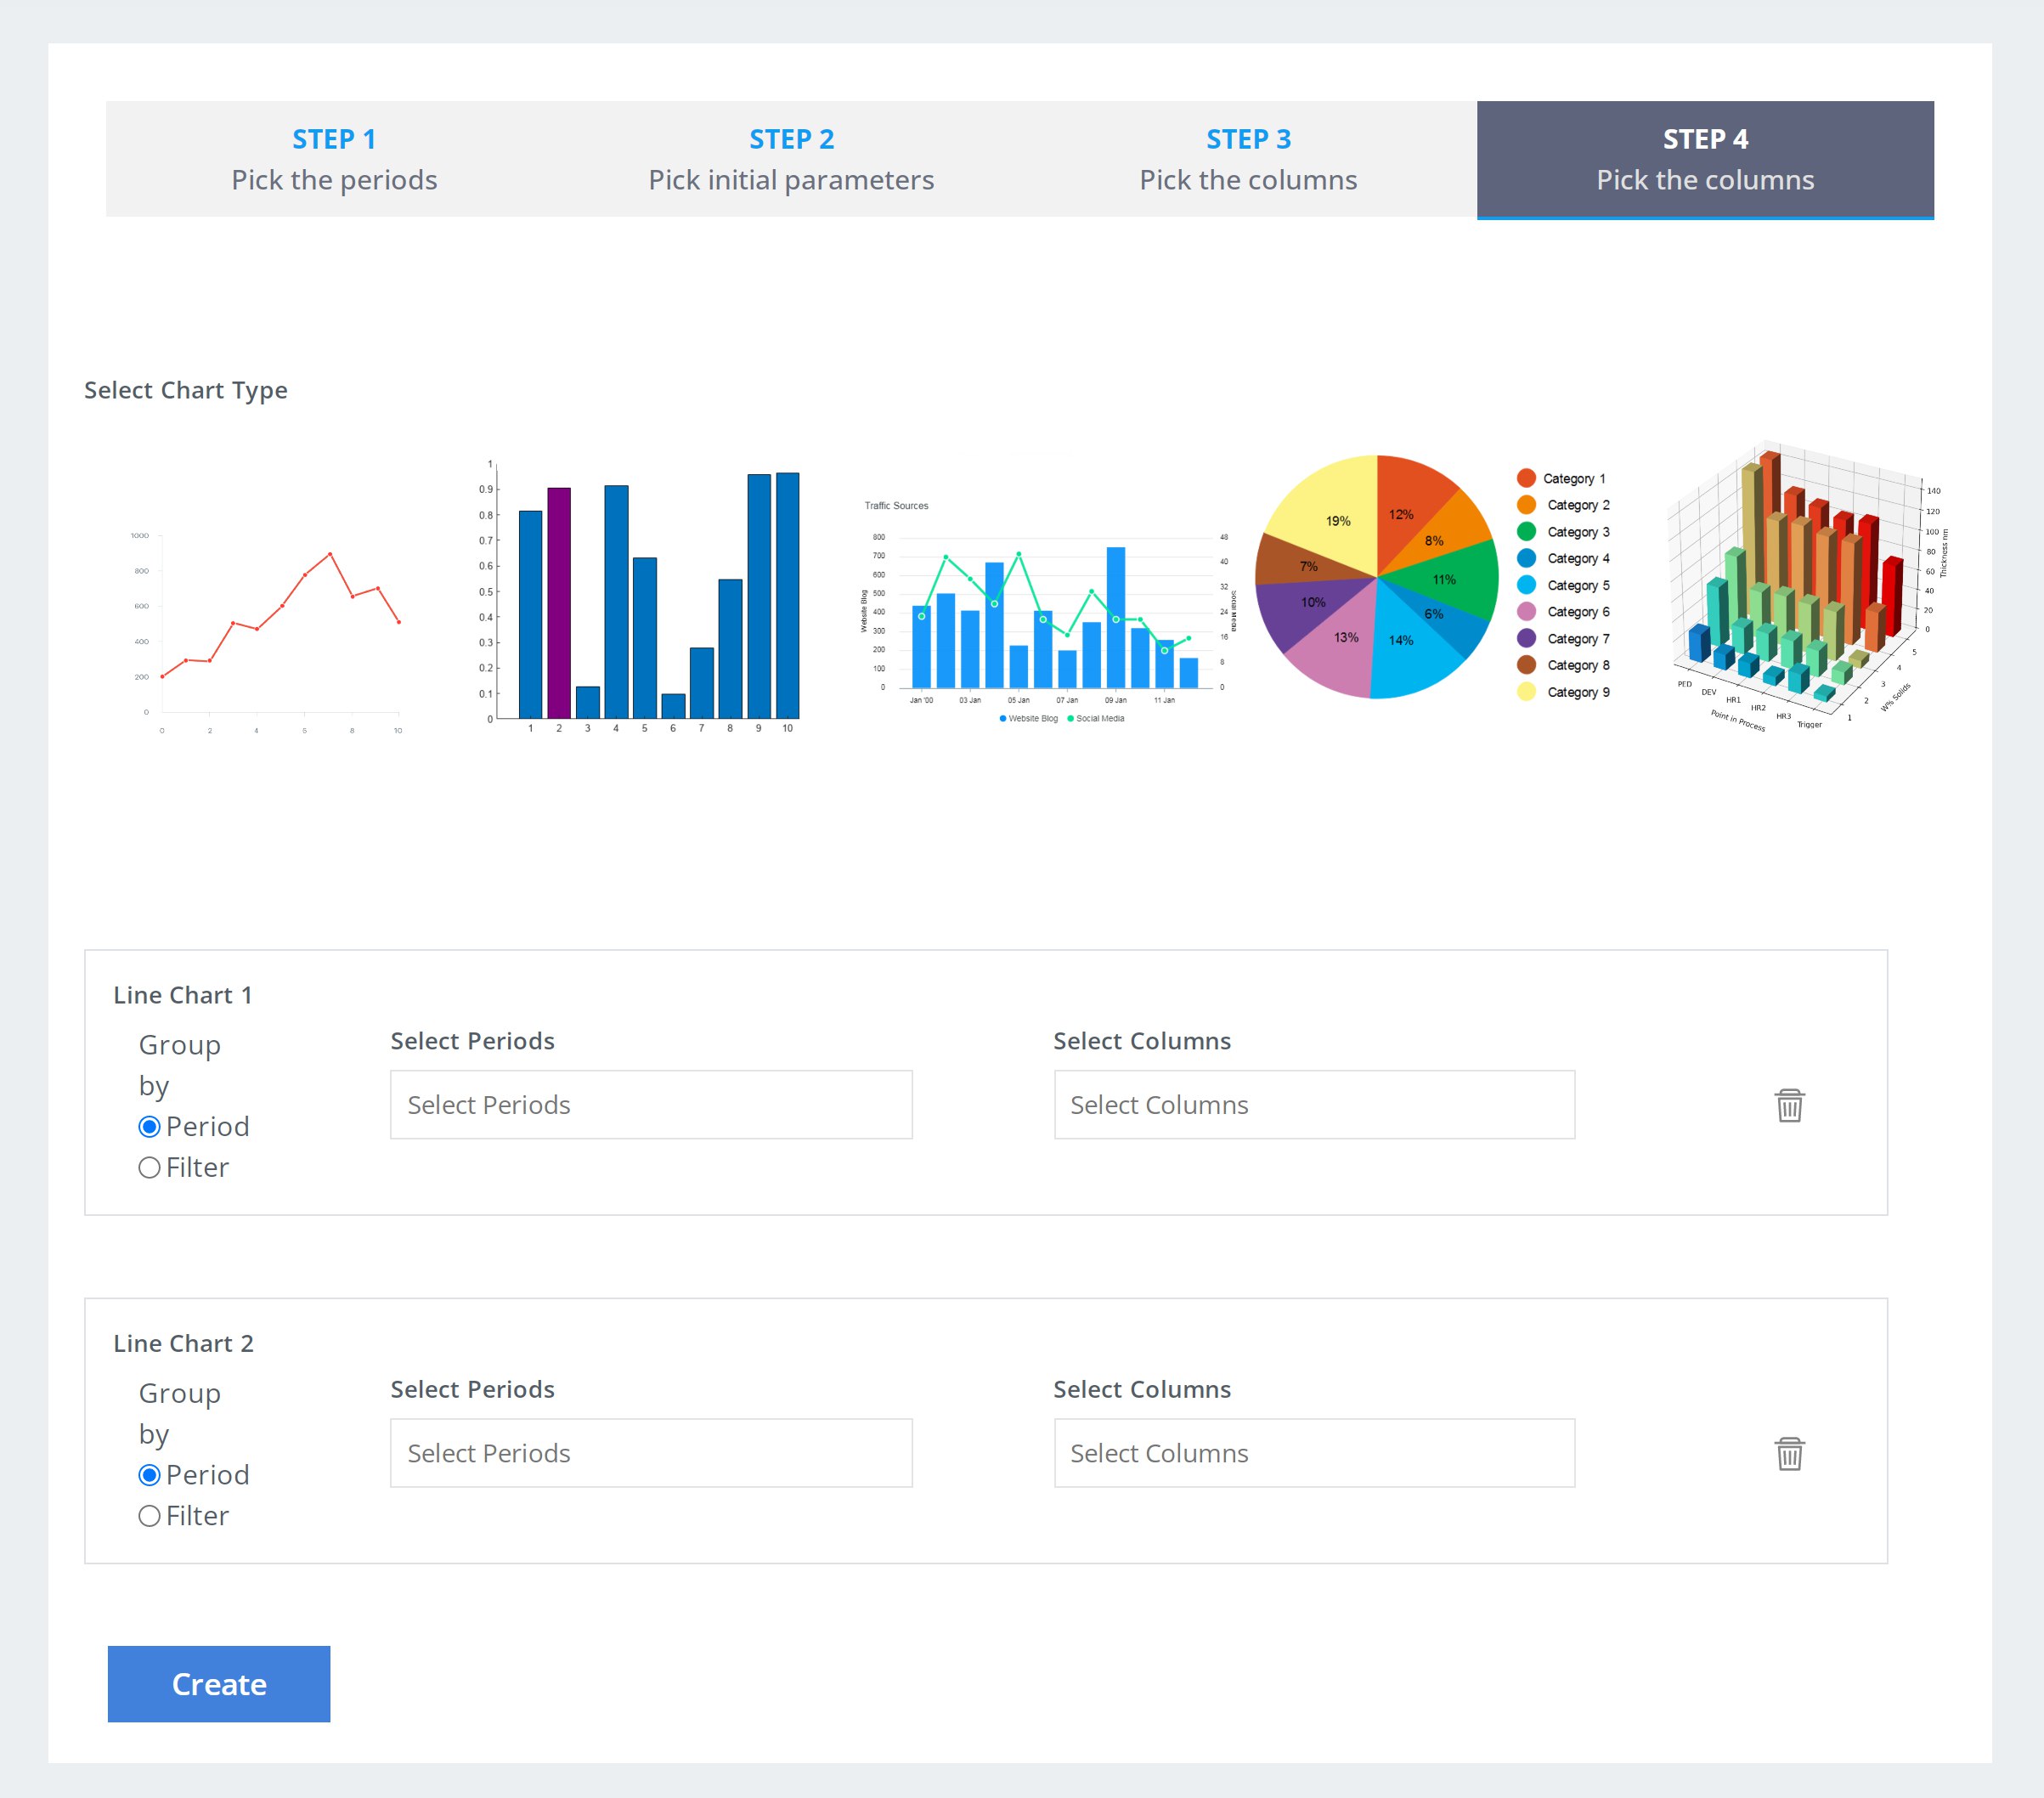
A chart generator is a software tool used to create different types of charts and graphs using every single column of database. It allows users to visualize data in a meaningful and easy-to-understand way, which is helpful for analyzing and interpreting data trends and patterns.
A chart generator offers a range of chart types, such as line charts, bar charts, pie charts, etc. The software tool allows users to input data, and then select the chart type that best represents the data.
Overall, a chart generator is an essential tool for businesses that rely on data analysis to make informed decisions. It simplifies the process of visualizing data, making it easier to communicate insights to others and improve decision-making.
How it works
- Choose the type of chart that you want to create.
- Organize your data into charts
- Once you are satisfied with your chart, export it to a file format that is suitable for your needs, such as PDF, Excel, or a graphical image. Alternatively, save the report or chart within the tool for future use.
In conclusion, Business Intelligence is crucial for businesses that want to succeed in today’s competitive environment. It provides businesses with insights into their customers, products, and markets, enabling them to make informed decisions and gain a competitive edge. By leveraging Business Intelligence tools and strategies, businesses can improve their efficiency, customer satisfaction, and profitability.


